2021 September Outlook for G7 Currencies
2021 September Outlook for G7 Currencies
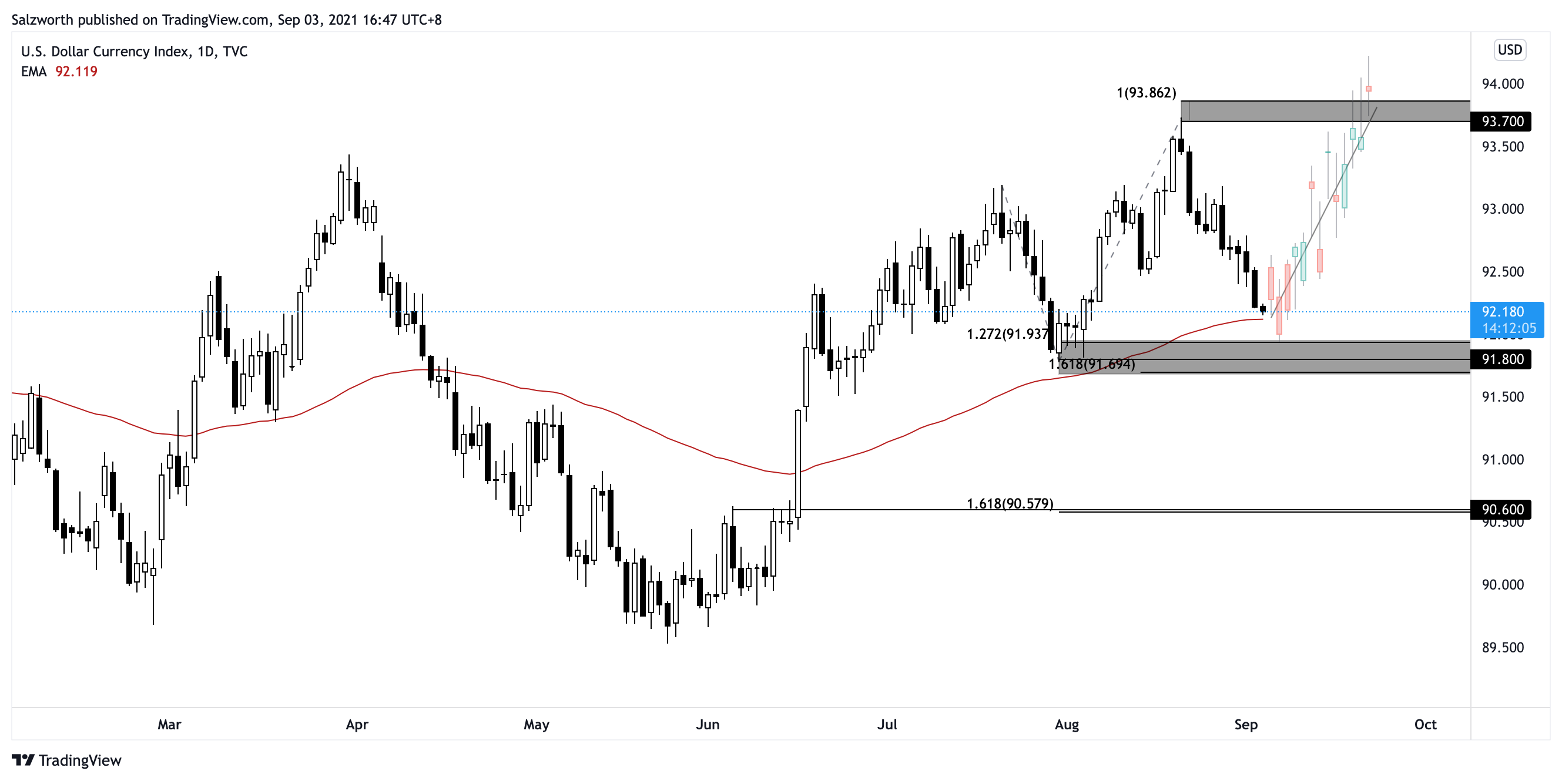
Dollar Currency Index: Bullish above 91.800
On the daily time frame, prices are facing bullish pressure from the support zone at 91.800 which coincides with the graphical low, 161.8% Fibonacci retracement and 127.2% Fibonacci extension. Price is now holding above the 55 natural MA which now acts as a dynamic support, adding confirmation to the bullish scenario. A pullback in prices to test its support zone at 91.800 presents an opportunity to play the bounce to the next resistance target at 93.700, which coincides with the graphical high and 100% Fibonacci extension.
DXY Fundamentals
The Dollar recovered in the first half of August, following stronger-than-expected non-farm payrolls data, which saw a rise by 943,000, indicating an improving jobs market for the U.S. Additionally, FOMC meeting minutes hinted at a possible slower pace of bond buying in mid-August, and investors’ worries over the unrest in Afghanistan bolstered demand for the safe-haven. However, in the second half of August, Federal Reserve Chairman Jerome Powell held off on any plans to begin rate hikes, saying that there is “still much ground to cover” before the economy reaches full employment, setting off the dip in the Dollar Index subsequently. Additionally, COVID-19 community transmission continues to be elevated in the U.S., and investors will continue to keep an eye on the pandemic situation and its subsequent hit on economic recovery. Going forward, the U.S. dollar could gain more traction if the Fed provides a more hawkish tilt in its stance on monetary policy.
Moving forward into September, we could see the dollar continue its rally with expectations from the Fed to start on asset tapering. August’s non-farm payrolls data is expected to show an improvement by 750,000, with the unemployment rate edging lower to 5.2% from 5.4%, following the rise by 943,000 in July. A stronger-than-expected result could push the Fed to start tapering before end-2021, extending the dollar’s rally. However, core retail sales data was disappointing, with retail trade falling 1.1%, led by a drop in auto purchases and a resurgence of COVID-19 infections hitting consumer demand. Some key data to look out for would be Consumer Price Index (CPI) data, which would give an indication of inflationary pressures on the U.S. economy.
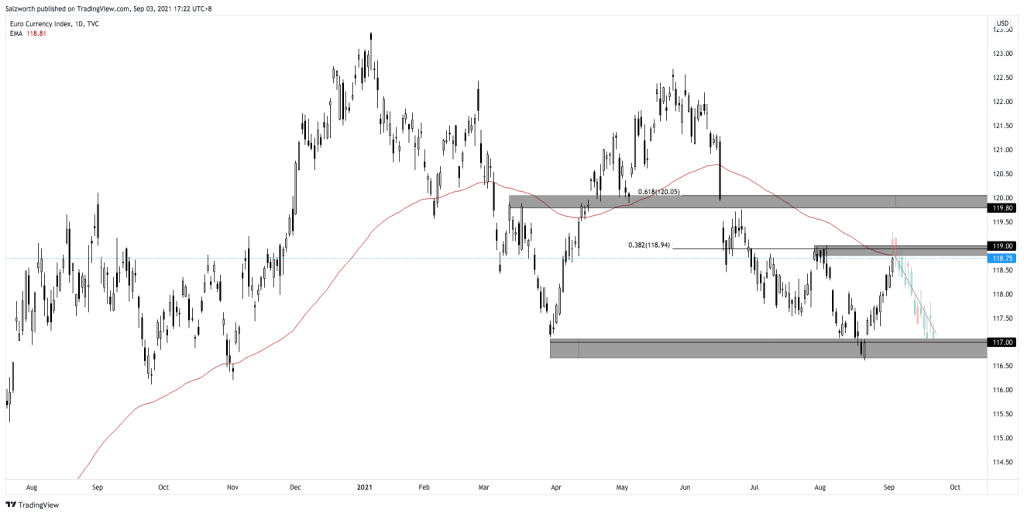
Euro Currency Index: Bearish below 119.00
On the daily time frame, prices are facing bearish pressure from the resistance zone at 119.00, in line with the 38.2% Fibonacci retracement and EMA which acts as a dynamic resistance. A reversal below the resistance zone at 119.00 presents an opportunity to play the drop to the next support target at 117.00. A break above the 119.00 resistance zone could see prices push higher to the next resistance area at 119.80, in line with the 61.8% Fibonacci retracement.

EUR Fundamentals
Euro dipped after the ECB minutes affirmed their dovish stance in keeping interest rates at record low levels, until “it sees inflation reaching 2% well ahead of the end of its projection horizon and durably for the rest of the projection horizon”. Towards the end of August, Euro managed to pare earlier month’s losses as Fed Chairman Jerome Powell signalled no hurry to raise interest rates despite the tapering of asset purchases, causing USD to weaken against their peers. Meanwhile, supply chain issues continue to hamper manufacturing growth and private sector activity in the region, weighing on the PMI data from the Eurozone. Looking ahead, in September, notable publications include the Eurozone’s manufacturing and services PMI data, German ZEW Economic Sentiment, German IFO business climate and ECB’s monetary policy statement.
British Pound Currency Index: Bearish below 138.50
On the daily time frame, prices are holding below the resistance zone at 138.50, which coincides with 61.8% Fibonacci retracement and 61.8% Fibonacci extension. The crossover below the 89 EMA which now acts as a dynamic resistance is adding further confirmation to the bearish scenario. A pullback in prices to test the resistance zone at 138.50 presents an opportunity to play the drop to the next support target at 136.20, in line with the graphical support zone and 61.8% Fibonacci extension.

GBP Fundamentals
Sterling dipped at the start of August before paring losses towards the end of the month. In its latest monetary policy meeting, the Bank of England maintained its interest rates at 0.1% to bring inflation back to its 2% target. Meanwhile, minutes from the BoE showed that UK-weighted global GDP growth was estimated to have risen sharply in 2021 Q2, as Covid vaccination programmes had gathered pace and restrictions had eased further. Other notable publications include the CPI data for July, which recorded a 2% growth, falling short of the 2.3% growth forecast as well as June numbers which came in at 2.5%. While global price pressures had continued to build, reflecting the speed and unevenness of the recovery in global activity, supply chain disruptions, and some shortages of inputs, the CPI numbers also showed that some of these factors were likely to be transitory and could subsequently unwind. In September, notable publications on the data front include the CPI, Retail Sales, PMI data which would provide more insight into UK’s economic recovery and guidance to Bank of England’s monetary policy meeting on 23 September.
Australian Dollar Currency Index: Bearish below 74.20
On the daily time frame, prices are currently trading around the graphical resistance zone and 50 EMA. Prices might react and push down towards horizontal swing low support which coincides with 161.8% Fibonacci retracement and 100% Fibonacci extension. Prices are also currently holding below the 50 period EMA which acts as a dynamic resistance where we saw prices react and reversed below the 50 EMA multiple times. However, a break above the resistance zone and EMA could see prices swing up towards the next resistance level on the daily timeframe of 75.50. This level coincides with the 127.2% Fibonacci extension and 61.8% Fibonacci retracement.

AUD Fundamentals
The Aussie dollar remained at $0.72 at the end of August, close to its lowest level since November 2020. Investors only expect a rate hike by Reserve Bank of Australia by 2023 as the Australian economy experiences slow economic growth due to the widespread impact of new lockdowns as a number of coronavirus cases hit new records. Chair of Reserve Bank of Australia Philip Lowe continues to remain dovish in the August monetary policy meeting by maintaining the cash rate target at 10 basis points and the interest rate at zero percent. Meanwhile, RBA will continue to purchase government securities at the rate of $5 billion a week until early September and then $4 billion a week until at least mid-November. Moving forward, investors should keep a close eye on Unemployment Rate on 16th September as well as RBA meeting minutes released on 21st September. A more bearish Aussie is expected to continue in the month of September with pressures on the pace of economic growth due to the impact of the coronavirus.
New Zealand Dollar Currency Index: Bearish below 71.50 level
On the daily time frame, prices are currently pushing up towards the descending trendline resistance, in line with pullback resistance in line with 127.2% Fibonacci retracement and 161.8% Fibonacci extension. A reversal could be seen towards the horizontal pullback support level at 67.80 which coincides with the graphical support zone. A break above the descending trendline resistance could see a further push up towards the next resistance zone at 73.00, in line with the graphical resistance zone and 78.6% Fibonacci retracement. Prices are also trading below the Ichimoku cloud, showing a bearish pressure for prices.

NZD Fundamentals
Kiwi dropped to as low as 68.0 in the month of August before paring losses. RBNZ was going to be the first country among the G10 currencies to hike interest rates after the pandemic era. However, RBNZ surprisingly decided to pull back on their decision on the interest rate hike due to an extended lockdown that was announced the day before. RBNZ maintained a hawkish stance even though they decided to keep interest rates at 0.25 basis points. NZX 50 jumped 0.92% to close at 7-month new highs after the Jackson Hole Symposium where Federal Reserve offered a more dovish tone that investors expected. Some key Kiwi news to look out for next month would be GDP released on 16th September and Trade Balance on 23rd September for investors to get an idea of the economic recovery state in New Zealand.
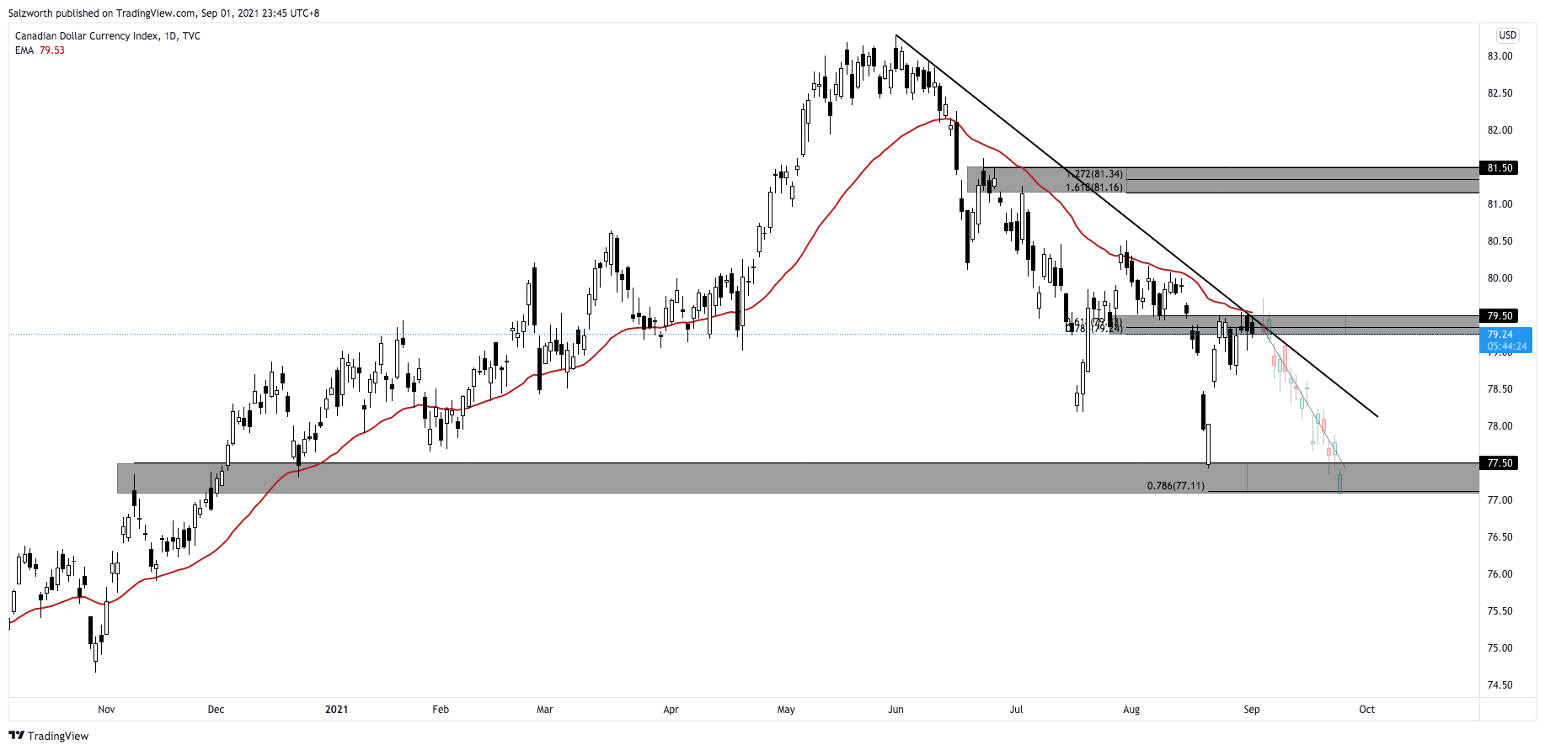
Canadian Dollar Currency Index: Bearish below 79.50
On the daily time frame, prices are holding well below the descending trendline resistance, which coincides with the graphical resistance zone, 61.8% Fibonacci retracement and 78.6% Fibonacci extension. Prices could see a further downside below this resistance zone, with 77.50 as the support target, in line with 78.6% Fibonacci extension and graphical support zone. A break above the 79.50 resistance zone and descending trendline resistance, could see prices push higher to test the next resistance zone at 81.50, which coincides with 127.2% Fibonacci retracement and 161.8% Fibonacci extension. Prices are also holding below the 34 EMA which acts as a dynamic resistance.

CAD Fundamentals
Canadian Dollar dipped at the start of August in a week dominated by risk aversion and signs of slowing growth in major economies and pandemic woes. However, there was a significant recovery towards the end of the month, buoyed by higher oil prices. WTI crude futures jumped to above $66 a barrel, riding on hopes of higher fuel demand after the US FDA granted full approval to Pfizer/ BioNTech vaccine, while China saw no locally transmitted coronavirus cases. Towards the end of August, the Canadian dollar also recovered some grounds when Federal Reserve Chairman Jerome Powell did not signal any deviation from the Fed’s recent assessment of economic conditions and outlook for tapering during the Jackson Hole Symposium.
On the data front, Canadian retail sales rose by 4.2%, in June, led by higher sales at clothing and clothing accessories stores as public health restrictions, which limited non-essential retail activities, were eased in many regions across the country. Come September, investors are keeping their eyes on the slew of major news events such as the Bank of Canada interest rate decision and Ivey Purchasing Manager’s Index on 8 September, unemployment rate on 10 September, Consumer Price Index on 22 September and Core Retail Sales data on 23 September.
Japanese Yen Currency Index: Bearish below 91.20
On the daily time frame, prices are approaching resistance at 91.20, in line with the weekly resistance zone and 61.8% Fibonacci retracement. We could see a reversal below this resistance zone to the 90.50 support zone, in line with the graphical low and 61.8% Fibonacci extension. Price is holding below the 89 natural MA as well, in line with the bearish bias. A break above the resistance at 91.80 could see prices push higher with 92.00 as the next resistance target.

JPY Fundamentals
The Yen continued to underperform against the Dollar in August. The yen managed to achieve 3-month highs at the start of August but started to depreciate against the dollar after the manufacturing sector registered a slightly weaker improvement in operating conditions in August. Consumer confidence index also edged down by 0.8 points to 36.7 in August, which is the weakest reading since May 2021. Going forward, investors are still concerned about the impact of the spread of the COVID-19 delta variant on the economy, and we expect that the Yen would continue to be bearish as compared to the major currencies, given the uncertainties in this pandemic situation.


