Weekly Technical Analysis Report 21 April – USDCAD played out nicely, limited upside seen on AUDUSD
Weekly Technical Analysis Report 21 April – USDCAD played out nicely, limited upside seen on AUDUSD
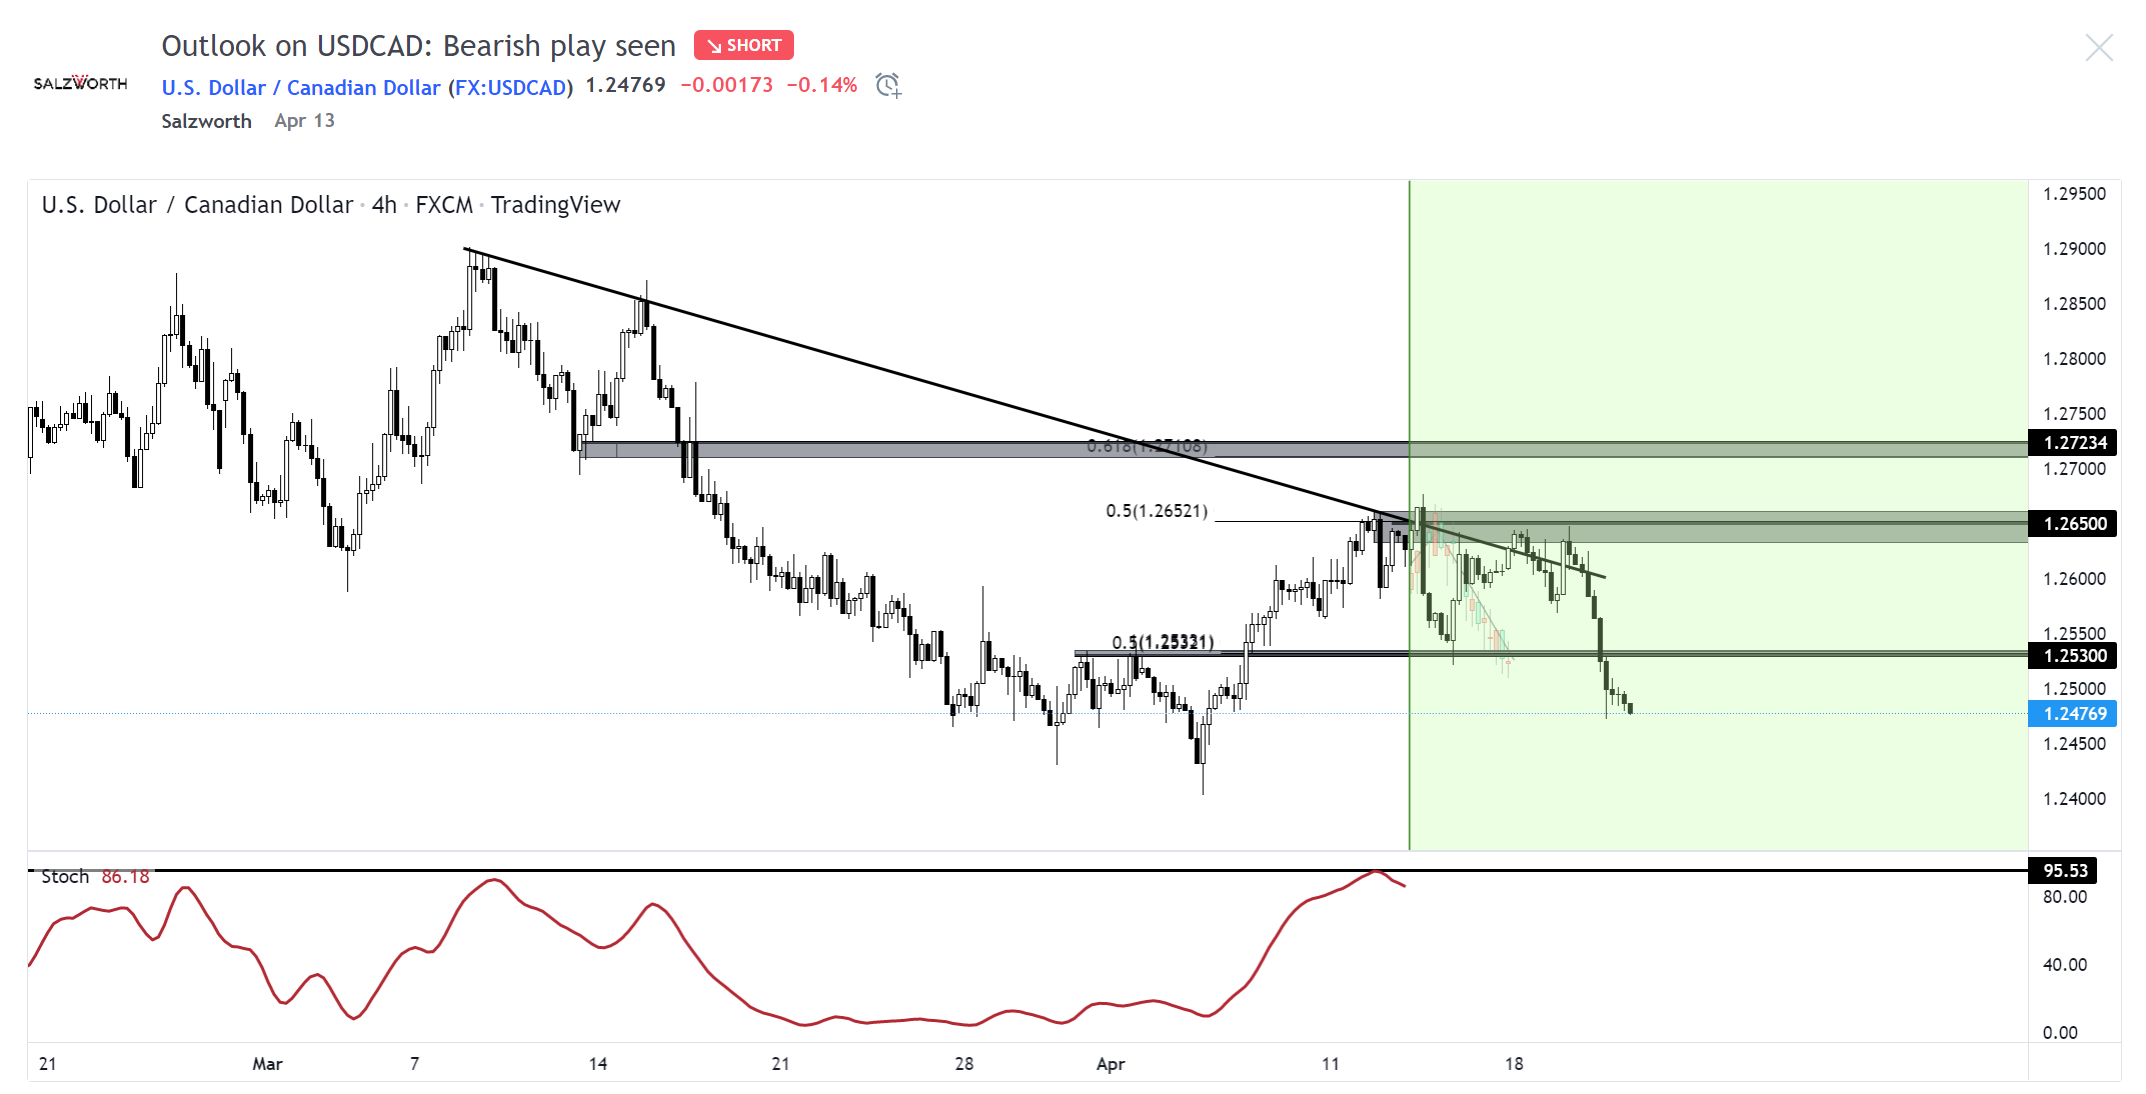
1. Last week’s outlook on USDCAD: Bearish play seen
On the H4 time frame, prices are testing resistance at 1.2650, in line with the descending trend line and 50% Fibonacci retracement where we could see further downside below this level to our support target at 1.2530. This support target coincides with our Fibonacci confluence levels which include the 50% Fibonacci retracement and 100% Fibonacci extension. Stochastic is testing resistance as well where we could see a reversal below this level.
USDCAD Chart (Note: Coloured candles represent our projection)
Before:

After:

Chart: https://www.tradingview.com/chart/USDCAD/AiIwiAbj-Outlook-on-USDCAD-Bearish-play-seen/
2. This week’s outlook on AUDUSD: Limited upside seen
On the higher time frame, prices are testing key resistance and we could be seeing limited upside here. On the H1 time frame, a pullback to test the support area at 0.7420, in line with the 100% Fibonacci extension, 38.2% Fibonacci retracement provides an opportunity to play the bounce to our resistance target at 0.74800. This resistance target lines up with the 78.6% Fibonacci extension level. Ichimoku cloud is showing signs of bullish pressure as well in line with our bullish bias.
Limited upside seen on AUDUSD by Salzworth on TradingView.com


