Weekly Technical Analysis Report 6 April – GBPUSD played out nicely, bullish play seen on Gold
Weekly Technical Analysis Report 6 April – GBPUSD played out nicely, bullish play seen on Gold
1. Last week’s outlook on GBPUSD: Further upside seen
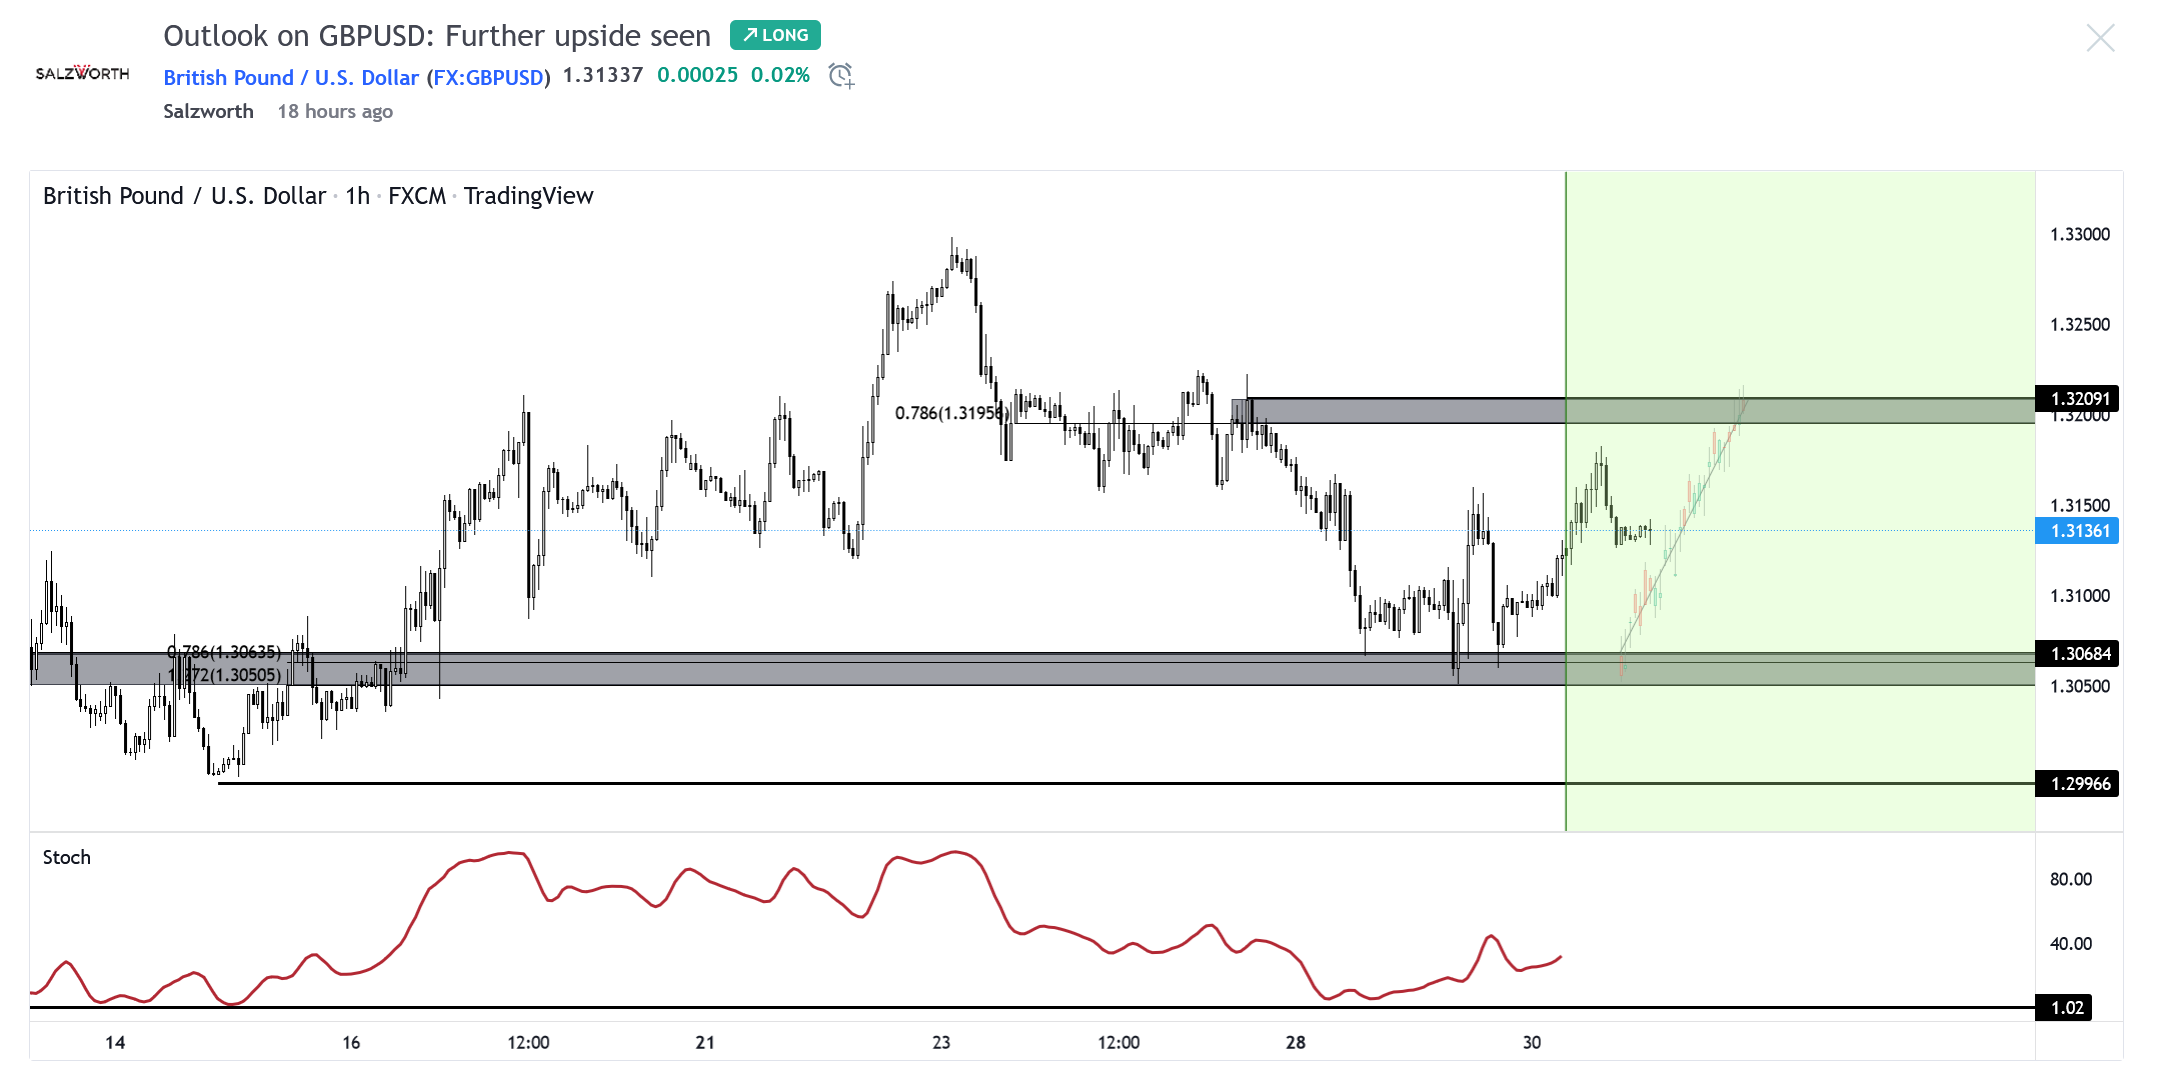
On the H1 time frame, prices are seeing bullish order flow in line with the pullback that we could be seeing on the daily time frame before it continues to the downside. The support level at 1.30684, in line with the 127.2% Fibonacci extension and 78.6% Fibonacci retracement presents an opportunity to buy, with 1.32091 as the resistance target. Stochastic is testing support as well where we could see further upside in prices, in line with our bullish bias.
GBPUSD Charts (Note: Coloured candles represent our projection)
Before:

After:

Chart: https://www.tradingview.com/chart/GBPUSD/MEb2RYpz-Outlook-on-GBPUSD-Further-upside-seen/
2. This week’s outlook on Gold: Bullish play seen
On the H1 time frame, prices are testing support at 1917.26, in line with the 50% Fibonacci retracement , 78.6% Fibonacci extension where we could see further upside in prices, with 1942.47 as our resistance target, in line with the 78.6% Fibonacci retracement. Stochastic is approaching support as well where we could see further upside above this level.
Outlook on XAUUSD: Bullish play seen by Salzworth on TradingView.com


