Weekly Technical Analysis Report 9 February – USDCAD played out nicely, bearish play seen on EURUSD
Weekly Technical Analysis Report 9 February – USDCAD played out nicely, bearish play seen on EURUSD
1. Last week’s outlook on USDCAD: Bearish play seen
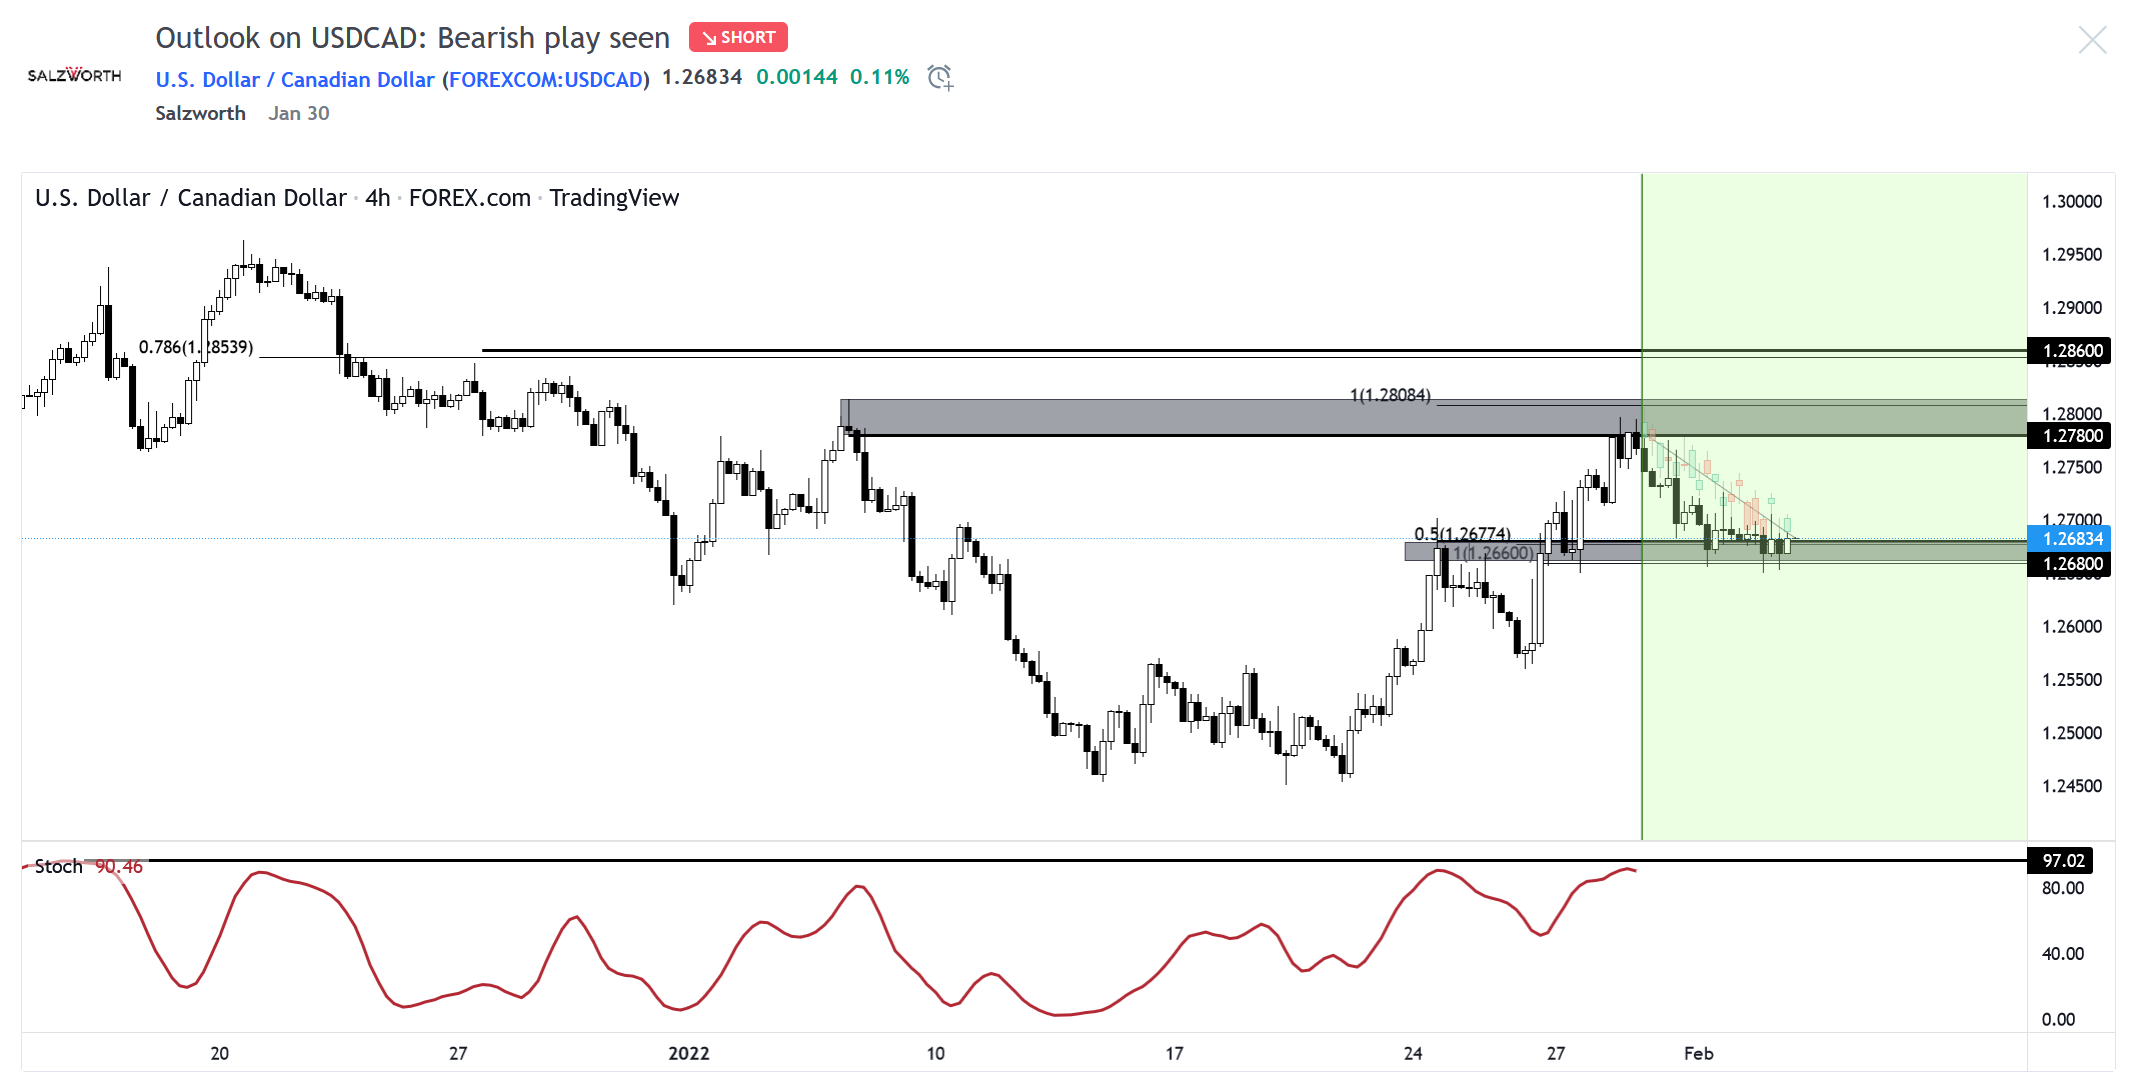
On the H4 time frame, we are seeing bearish order flow on USDCAD, with prices currently testing a key resistance area at 1.27800. This resistance area lines up with the 100% Fibonacci extension where we could see a reversal below this level, to the next support target at 1.26800, in line with the 50% Fibonacci retracement and 100% Fibonacci extension. Stochastic is approaching resistance as well where we could see a reversal below this level, in line with our bearish bias.
USDCAD Charts (Note: Coloured candles represent our projection)
Before:

After:

Chart: https://www.tradingview.com/chart/USDCAD/60PYPkfq-Outlook-on-USDCAD-Bearish-play-seen/
2. This week’s outlook on EURUSD: Bearish play seen
On the H4 time frame, prices reversed below a key resistance zone with the supply chain being formed and respected on the M30 time frame. A pullback to test the resistance zone 1.14408, in line with the descending trend line, 78.6% Fibonacci retracement, 78.6% and 127.2% Fibonacci extension presents an opportunity to play the drop to the next support target at 1.13027, which coincides with the 50% Fibonacci retracement.
Outlook on EURUSD: Bearish play seen by Salzworth on TradingView.com


